Рус
Рус


Database Update: Pharmaceutical Drug Production in Russia (January 2019)
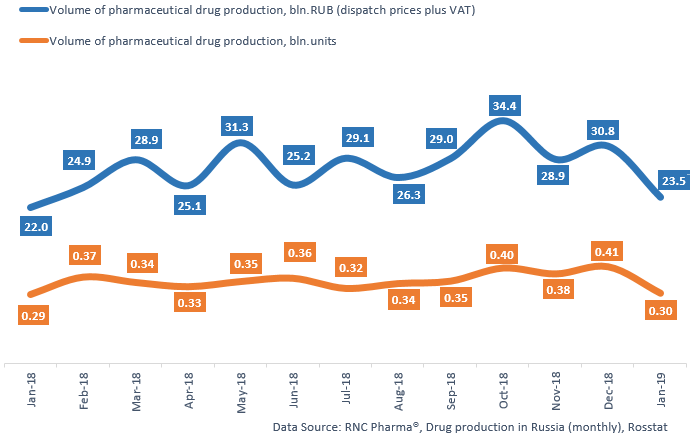
January 2019 saw the typical seasonal decrease, with the dynamics of the dispatched Russian pharmaceutical drug production being -24% in monetary terms and -26% in physical terms. However, the dynamics of the total Russian pharmaceutical drug production are +6.5% in monetary terms and +2.7% in physical terms.
If calculated in minimum dosage units (MDU), the dynamics are -8.3%. In January 2019, Russian manufacturers produced 302.5 mln units of pharmaceuticals, which is 5.1 bln MDUs or 23.5 bln RUB (dispatch prices, VAT included.)
The dynamics of the OTC drug production are +1.7%, which is the highest dynamics over the past 7 months; the last time the dynamics have been positive was in October 2018 (+1%.) The dynamics of the Rx drug production are +4.9%.
Among the top 10 OTC drug producers, Samaramedprom has the highest dynamics (a 2.5 times increase in physical terms.) The production of Menovazin, Iodine, Pertussinum, and Licorice Root contributed to the dynamics. Marathon Pharma has high dynamics as well, +61% in physical terms; its anti-rhinitis drug Rinorus contributed to the dynamics (a 2.1 times increase.)
Among the top 10 Rx drug producers, Biotec and Solopharm have the best dynamics (2.1 and 1.7 times increases, respectively.) Biotec’s cephalosporin Cefazolin contributed to the dynamics with a 5.3 times increase, as well as Ceftriaxone with 2.8. Glucose, Piracetam, and Aqua ad Inject contributed to Solopharm’s dynamics with 78, 3.2, and 2 times increases, respectively.
Read more about pharmaceutical drug production in Russia (December 2018) here: http://www.rncph.com/news/25_01_2019
Dynamics of pharmaceutical drug production in Russia, including production of pharmaceuticals of foreign companies on owned or contract plants, in physical (units) and monetary terms (RUB, VAT included) (January 2018 – January 2019)