Рус
Рус


Pharmaceutical Drug Import to Russia (August 2020)
Between January and August 2020, Russia imported RUB 314 bln worth of ready-made drugs (customs clearance and VAT included), which is in monetary terms (rubles) 21% lower than in 2019. This year the import dynamics are practically determined by administrative procedures associated with the launch of the labeling system, not so much by the demand situation since the launch has completely changed the usual seasonal behavior of participants in foreign economic activity for most of the mass-market drugs. These trends were much less relevant for in-bulk drugs, with the dynamics of +17.4% in monetary terms and the import volume of RUB 89.4 bln.
As for physical terms, the dynamics of the import of ready-made drugs are -36%, with the import volume of 765.4 mln units. If calculated in minimum dosage units (MDU), the dynamics are -32.5% and the volume is 13.3 bln MDUs. The dynamics of the import of in-bulk drugs are also negative (-37%), despite the high import volume of 1.45 bln MDUs.
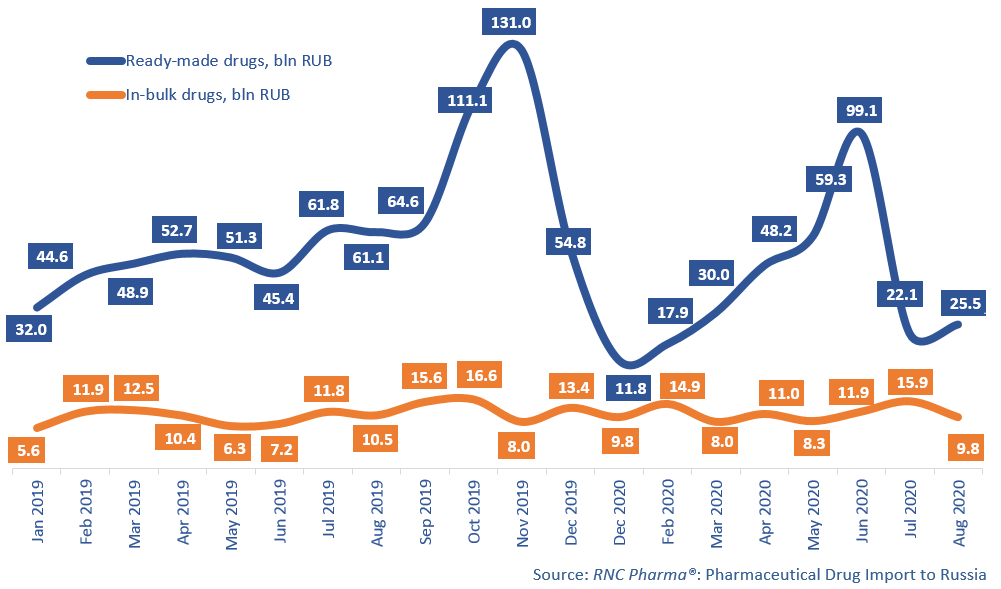
The August results more or less followed the trends set in early 2020. A natural decline came after the peak dynamics in June 2020, and the activity of importers in July and August 2020 was 2-3 times lower than in 2019. Thus, the import dynamics in monetary terms were -58% for ready-made drugs and -7% for in-bulk.
Nine out of the top 15 importers of ready-made drugs have negative dynamics for the period between January and August 2020. за январь-август 2020 г. BMS and MSD have the highest dynamics; the former has increased its imports by 2.3 times in monetary terms, and the company’s Abraxane and Yervoy contributed to the dynamics the most, with the total import volume of RUB 10.6 bln (customs and VAT included). The latter's dynamics are +43% in monetary terms, with Gardasil contributing to the dynamics the most (imports grown by 8 times, to more than RUB 1.1 bln).
As for the top 15 companies that import in-bulk drugs, Astellas has the best dynamics (imports grown by 2.9 times). With the import volume of more than RUB 1.5 bln, Flemoxin-Solutab was the company’s most imported drug. Out of the top 15, Replekfarm has the highest dynamics (imports grown by 4.4 times). Its Azithromycin and Carvedilol contributed to the dynamics the most; both products are packaged at the facilities of Beryozovsk Pharmaceutical Plant (AS Byuro Group) in the Sverdlovsk region.
Dynamics of import of pharmaceuticals to Russia (EEU countries excluded), free circulation prices including customs clearance and VAT, RUB (January 2019 – August 2020)