Рус
Рус


API Import to Russia (September and Q1 – Q3 2020)
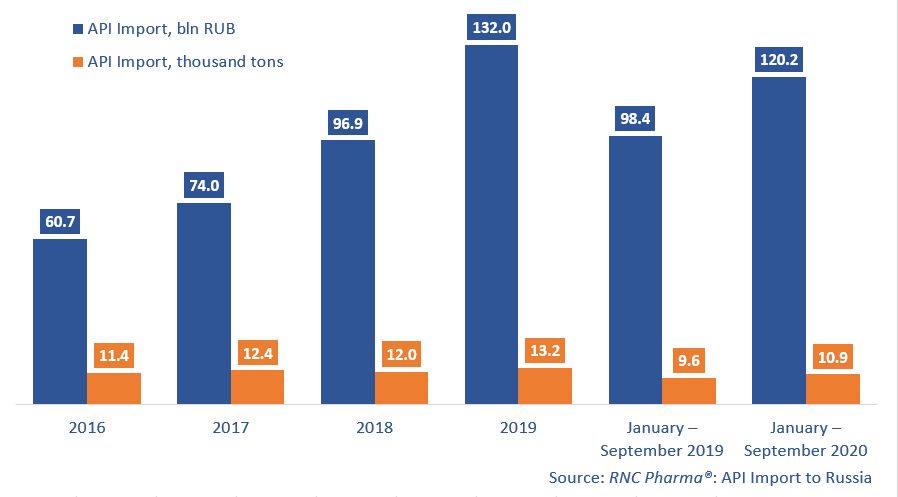
Between January and September 2020, Russia imported RUB 120.2 bln worth of APIs (customs clearance and VAT included), which is in monetary terms (rubles) 22% lower than in 2019. The import volume in physical terms (tons) amounted to 10.9 thousand tons, with the dynamics of +14%.
Importers’ activity back in January, as well as from March to June, made the high dynamics in physical terms. The growing imports was attributed to the coronavirus epidemic at first and the launch of the labeling system by early summer. The dynamics in monetary terms started to decline in July and those in physical terms – in August. September followed that tendency, with the dynamics of -24% in monetary and -8% in physical terms.
China has the best dynamics in both monetary and physical terms. The country’s dynamics in monetary terms (+46%) are more than twice as high as those of the whole market. The dynamics of the API import in physical terms are +19% (against +14% of the market).
However, these are far from record-worthy in the top 30; the API import from Malta has increased by 26 times in monetary terms. Only one API, antiestrogen Fulvestrantum, imported by Biocad for the production of Fazotikad in Petrovo-Dalneye, contributed to the dynamics.
China is followed by Sweden; the latter’s imports of APIs have grown by nearly 16 times. Deeper localization of production played a big part here; AstraZeneca has been importing antiaggregant Ticagrelorum since late 2019, when the full-cycle production of Brilinta was launched in the Kaluga region. Industrial-scale production has begun this year.
The importers from Great Britain and Argentina are also worth-mentioning (imports grown by 4.9 and 4.4 times in monetary terms, respectively). Materia Medica was importing around 40 grams of NO synthase antibodies from Great Britain. The manufacturer’s periodic imports are known to have been distinctive: in 2019 it imported 80 grams of antibodies to morphine, and in 2018 - 40 grams of antibodies to histamine.
As for Argentina, R-Pharm was importing Glatirameri Acetas (production in Yaroslavl) and Dasatinibum.
Dynamics of pharmacopoeial and commercial API import to Russia (EEU countries excluded), free circulation prices including customs clearance and VAT (2016 – 2019, January – September 2020)