Рус
Рус


Pharmaceutical Drug Production in Russia (March and Q1 2023)
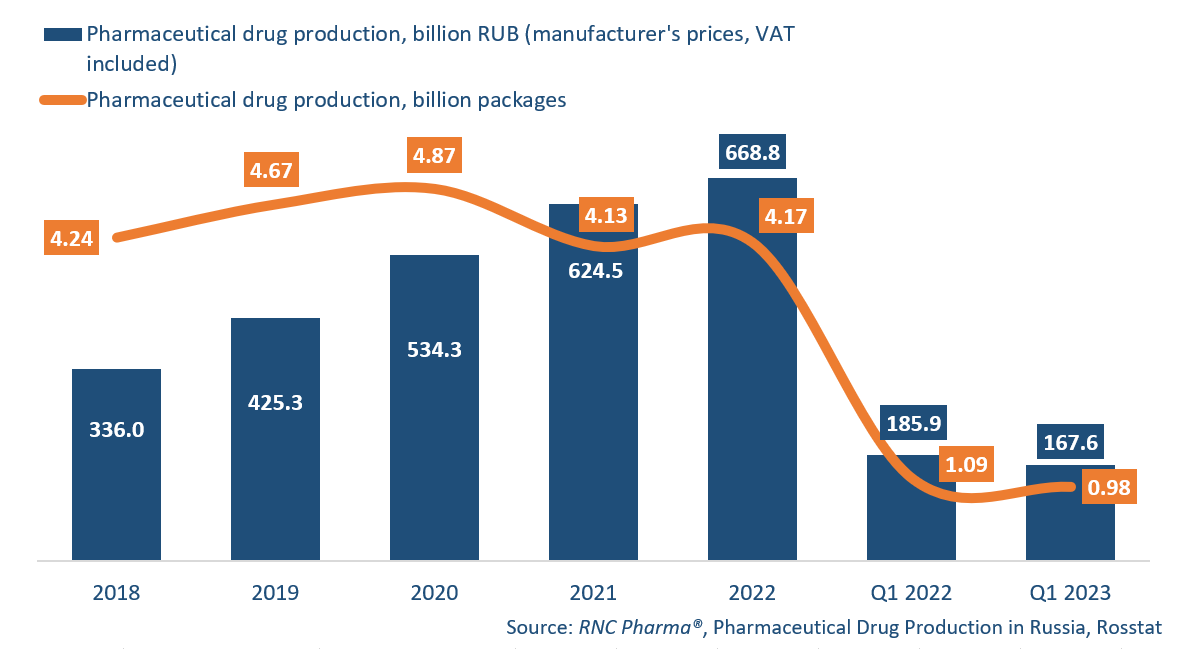
In Q1 2023, Russian manufactures produced 167.6 billion rubles’ worth of ready-made pharmaceutical drugs (manufacturer’s prices, VAT included), down 9.8% from Q1 2022. In physical terms, the production was 0.98 billion packages, down 10.3% from Q1 2022. If calculated in minimum dosage units (MDU), the production went down 3.9%, with 19.1 billion MDUs.
In fact, the production in physical terms has been falling since January—back then, it went down 6%, and in March 2023, down 16.2%. However, the base period saw a huge surge in demand as a result of Russia’s special military operation, meaning the production volume then was still noticeably higher than usual. Yet, the work of market participants this year is clearly affected by the decline in consumer activity that followed the decline in household incomes.
The number of manufacturers in January–March 2023 was 356, up 15 from January–March 2022. The number of INNs went up from 1,135 in January–March 2022 to 1,163 in January–March 2023.The production of both Rx and OTC drugs decreased. The production of prescription drugs in Q1 2023 fell by 6.2% in packages and by 3.9% in MDUs from Q1 2022. The number of INNs in Q1 2023 was 808, up 26 from Q1 2022. Among the most manufactured 50 INNs in physical terms, ketoprofen and dexketoprofen had the best growth rates—production grew 3.6 and 3.5 times, respectively. Prescription drugs containing ketoprofen were produced by 10 manufacturers in January–March 2023, with Ketonal by Novartis contributing to the growth rates the most (the production is localized at the company’s plant in St. Petersburg). Drugs containing dexketoprofen were manufactured by 7 companies, with Dexonal by Binnopharm contributing to the growth rates the most. In addition, the production of oseltamivir increased 2.5 times against January–March 2023. It was manufactured by 8 companies, and Pharmasyntez and Avexima helped the growth rates the best.
Production of OTC drugs in January–March 2023 decreased 13.4% in packages and by 3.9% in MDUs. The number of INNs fell by 2—to 404. Among the top 50 drugs, medicines containing rimantadine and oxymetazaline had the best growth rates—their production went up 3.3 and 2.3 times, respectively. Rimantadine was manufactured by 8 companies, with Usolpharm and Tatkhimfarmpreparaty contributing to the growth rates the most. Preparations containing oxymetazoline were produced by 6 manufacturers; the production of Rankof and Mikfetin helped the growth rates the best. The production of naphazoline continued to grow as well (up 2.1 times against January–March 2022). Drugs containing naphazoline were produced 8 companies, but Slavyanskaya Apteka contributed to the growth rates the most.
Pharmaceutical drug production in Russia, including production of pharmaceuticals of foreign companies on owned or contract plants, in physical (packages) and monetary terms (RUB, VAT included) (2018–2022, Q1 2023)