Рус
Рус


Database Update: Pharmaceutical Drug Production in Russia (February 2019)
Between January and February 2019, Russia produced 53.6 bln RUB worth of pharmaceuticals (dispatch prices, VAT included), which is in monetary terms 14.3% higher than that of the same period in 2018. In physical terms, the dynamics are -1.5%, with 651.5 mln units.
The dynamics of the OTC drug production in physical terms are -4.6% for the period, while those of the Rx drug production are +3.7%. Among the top 10 EphMRA groups of second level which are leaders in physical terms, systemic antivirals (-43%), antirheumatics for local administration (-16%), and vitamins (-13%) have the worst dynamics. Among the top 10 OTC drug-producing companies with the highest dynamics in physical terms, Tatkhimpreparaty and Ozon have the biggest drop, -52% and -36%, respectively. Despite the overwhelmingly negative dynamics, there are still companies with positive dynamics. For instance, Samaramedprom has a 2.4 times increase, which is the best dynamics among the OTC drug-producing companies.
As for Rx drugs, the following categories have the worst dynamics in physical terms: solutions for intravenous admission (-36%), antiseptics and disinfectant drugs (-22%), and systemic antibacterials (-21%.) Diuretics (+58%) and anti-inflammatory and antirheumatics (+38%) have the highest dynamics. Groteks and Ozon have the highest dynamics in physicals terms, with +52% and +30%, respectively.
Read more about pharmaceutical drug production in Russia (January 2019) here: http://www.rncph.com/news/06_03_2019
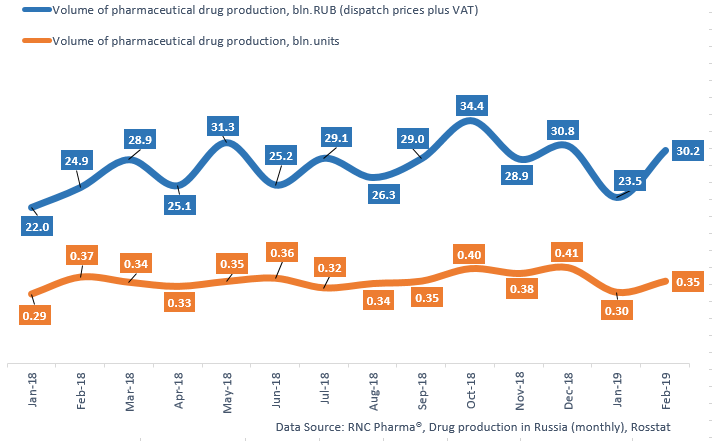
Dynamics of pharmaceutical drug production in Russia, including production of pharmaceuticals of foreign companies on owned or contract plants, in physical (units) and monetary terms (RUB, VAT included) (January 2018 – February 2019)